Manage your Application
Once your application is deployed, you can manage it using the StateMesh Console by going to the details page of your application.
Application Details
General information about the application is available in the cards at the top of the page.
Let's consider the following example:
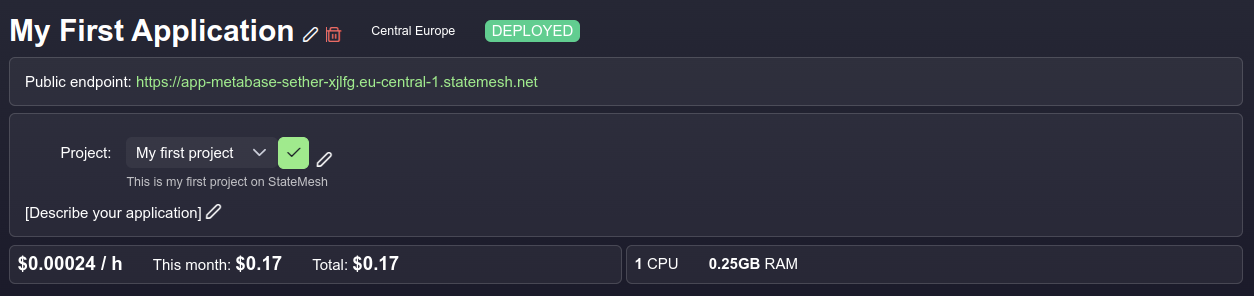
The following information is available:
- Name of the app: The name of the application -
My First Application. - Zone: The zone where the application is deployed -
Central Europe. - Status: The current status of the application -
DEPLOYED. - Public Endpoint: The public endpoint of the application -
https://app-metabase-sether-xjlfg.eu-central-1.statemesh.net. - Project: The project to which the application belongs -
My First Project. - Description: A brief description of the application -
[Describe your application]. - Hourly cost: The hourly cost of the application -
$0.00024 / h. - Month-to-date cost: The cost of the application for the current month -
$0.17. - Total cost: The total cost of the application -
$0.17. - Number of vCPUs allocated: The number of vCPUs allocated to the application -
1. - Memory allocated: The amount of memory allocated to the application -
0.25 GB.
Application Control
The Status tab of the application shows the current status of the application and provides several actions that can be performed on the application.
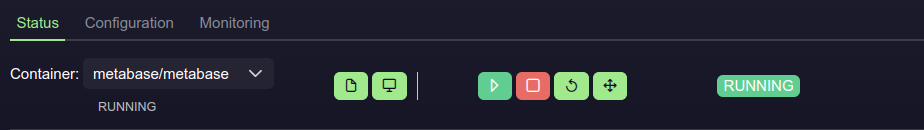
The following options and actions are available:
- • Container: choose a container running inside application. You will see its status below:
RUNNINGorTERMINTED - •
 : Start the container
 - •
 : Stop the container
 - •
 : Restart the container
 - •
 : Scale the number of replicas for the application
Container Logs
You can bring up the logs of the container by clicking the  button.
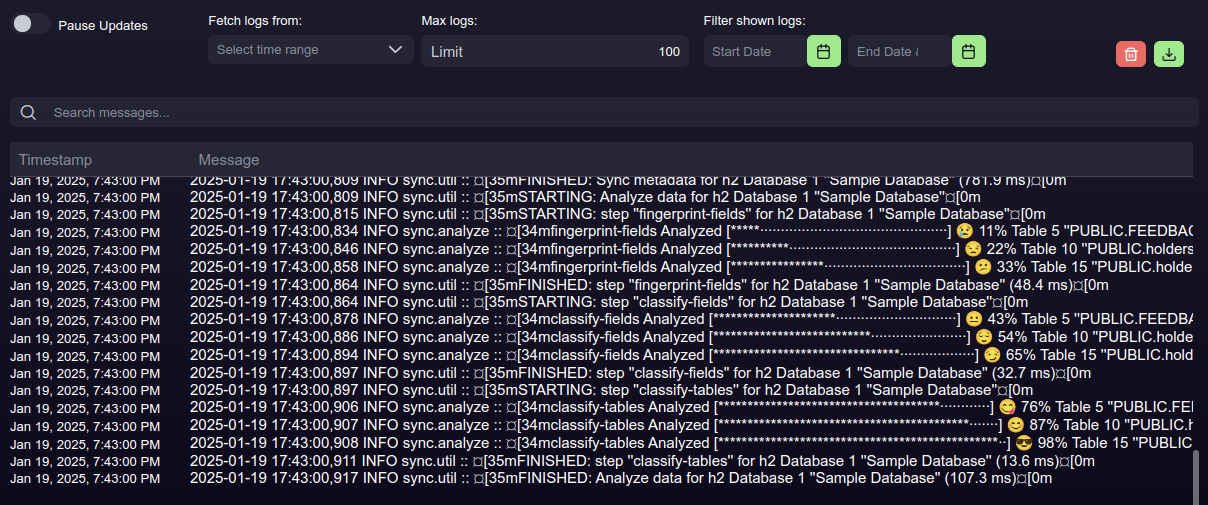
The following options and actions are available in the logs view:
- Pause updates: Pause the live update.
- Fetch logs from: Apply a time filter to show recent from the last number of minutes.
- Max logs: Set the maximum number of log lines to display.
- Filter shown logs: Filter the log based on a date range.
- Clear logs: Clear the log from the view.
- Download logs: Download the log as a file.
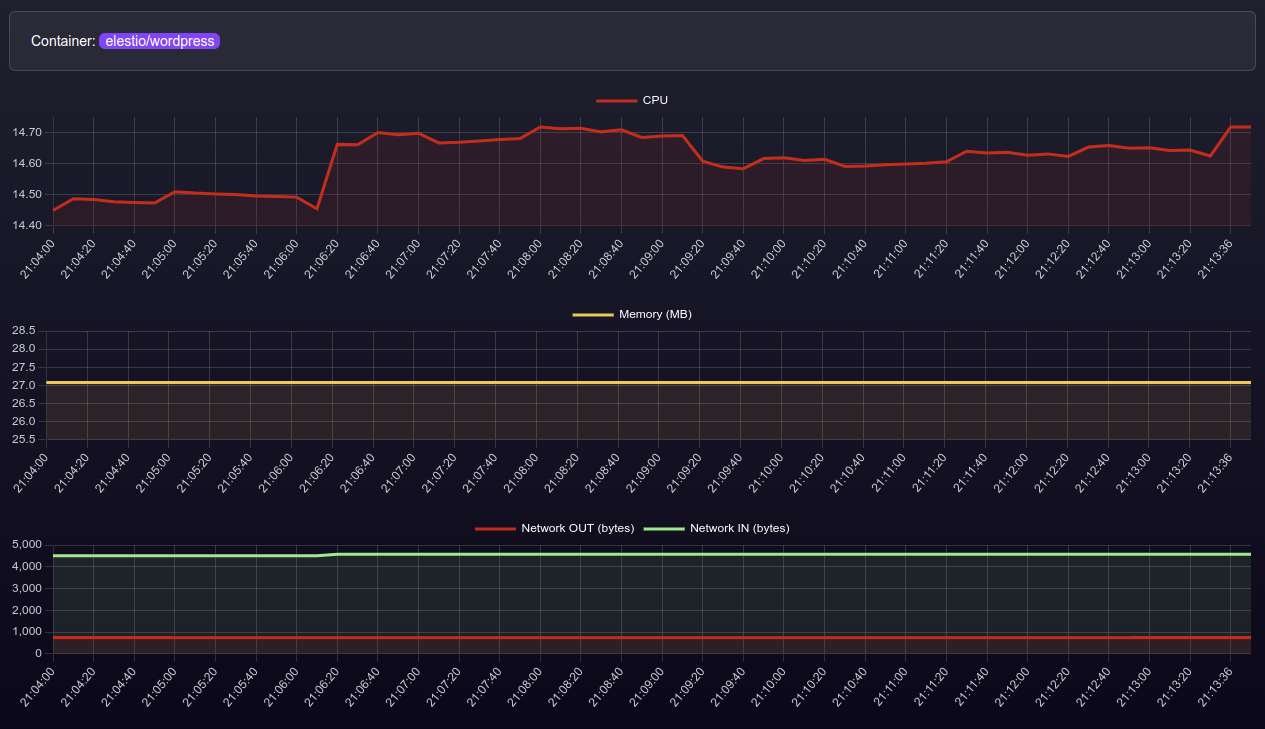
Resource Usage
The Monitoring tab of the application shows the resource usage of the application for each container.